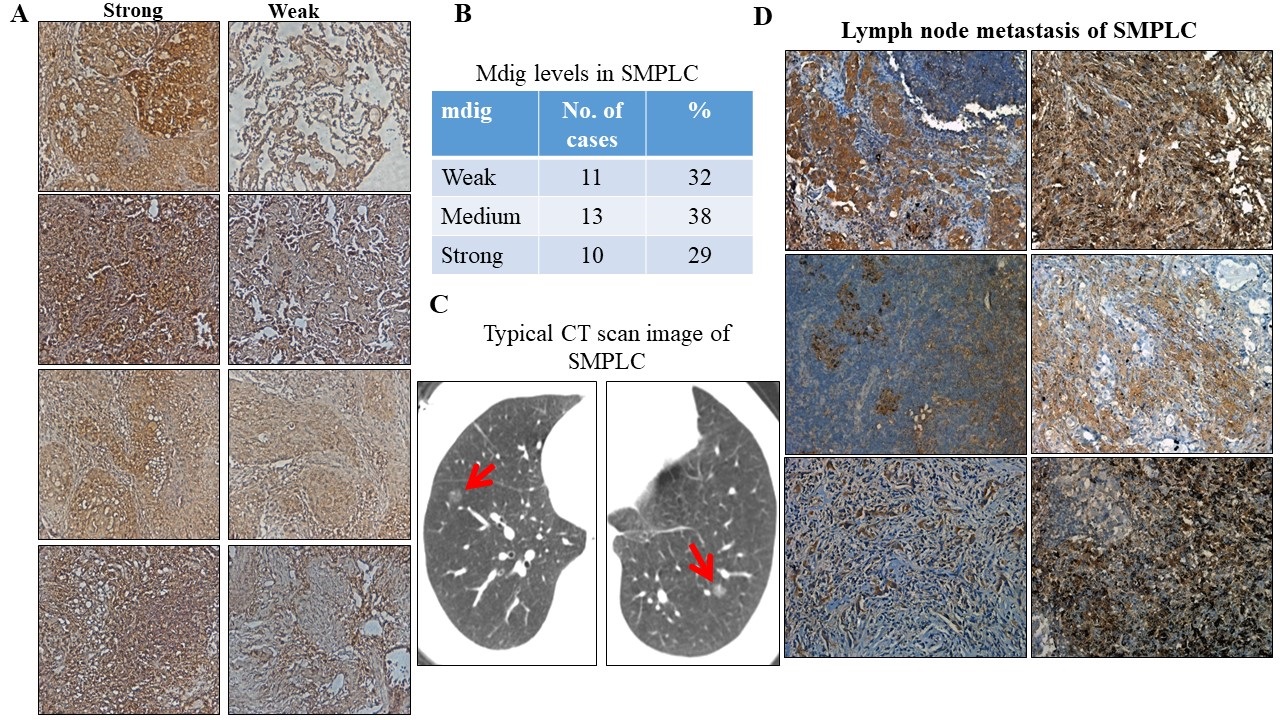
Fig. 5. Variability in mdig expression in SMPLC and metastatic lymph nodes. (A) Regions of tumor showing both weak and strong mdig-stained areas within the SMPLC from the same individual patients. (B) Staining quantification of the mdig-stained SMPLC samples. (C) Representative image displaying CT scan of a SMPLC patient showing multiple primary tumors in the lung (red arrows). (D) Formalin-fixed paraffin-embedded metastatic lymph node tissue sections from SMPLC patients were stained for the mdig protein. Areas shows mdig positive cells. Representative images from 14 cases.